In early September, Google presented its Data Studio Community Connectors Developer Launch. The purpose of the launch is to enable data visualization. Among the ten featured partners and more than 200 data sources, we were especially happy about Supermetrics as a partner and Facebook as a source of information. Yes, you got that right: you can now visualize and automate Facebook data in Google Data Studio! This service and the ability to import third-party data, which will be automatically fetched through partners, will enable us even more effective monitoring of campaigns and reporting. We at 404 continuously follow trends and introduce new tools that can enhance the quality of our service. With Data Studio Community Connectors, we have the ability to round off the visualization, analysis and reporting service.
What is Google Data Studio and what are its main benefits?
Google Data Studio is a data visualization tool that allows you to create simple and divisible dashboards with many customization options (for example, background, colour, font, text, graph size, etc.). The tool's specificity is the ability to connect to a large number of Google products (such as Analytics and AdWords), of which Google Sheets should be specifically mentioned. By linking Sheets to Data Studio, you can import any type of data, regardless of whether the data is online or offline. An additional advantage of the tool is automatic data synchronization. Once you have linked a traffic source (e.g. Analytics), the data is automatically retracted for the selected period. However, if you enter offline data, you must manually update the Sheets spreadsheets before data can be synced with Data Studio. In 404, we use Data Studio dashboards to report to clients, create internal reports, track trends, and determine benchmarks.
Importance of Data Studio Community Connectors
The problem that bothered the digital community was the inability to fetch third party data in Data Studio. Everything could be solved using Sheets. However, what was lacking was automatic data synchronization without the need for making any changes. By introducing Data Studio Community Connectors, Google has enabled developers to build their own connectors using Google Apps Script. Once a connector has been built, developers can share it with the entire world and thus contribute to the community.
Starting out, Google has introduced ten partners and more than 200 traffic sources, and constant updating of the Community Connectors gallery is expected, where you can view all the currently available community connectors. To connect to some of the community connectors, you will also need to have access to a partner who has developed the connector for the mentioned data sources (you might be charged for partner access). If you are good at using the Google Apps Script and APIs, and you have special requirements and currently there are no connectors you are looking for, try to create your own and say goodbye to manual entries into Google Sheets!
Fetch data from Facebook in Google Data Studio
As we have been using Supermetrics to fetch data from a number of sources for a long time, we were very happy to hear that Supermetrics is one of the first Google partners to join the Community Connectors program.
With this we are able to import data from 20+ different data sources, of which we were especially excited about Facebook, given that, until now, we imported this data into Data Studio through a Google Sheet associated with Supermetrics. Why were we particularly happy about Facebook's data? Automated Facebook data was the only data preventing our 404 dashboard experience from becoming even more tangible!
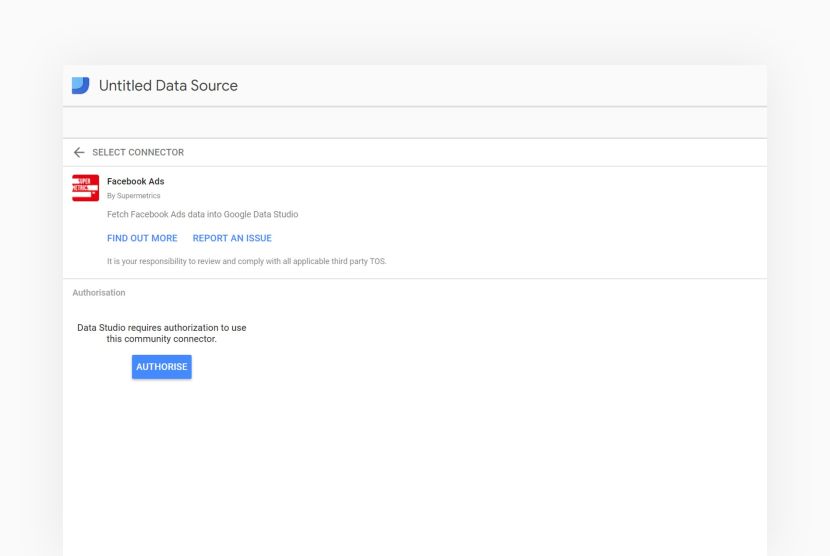
To start connecting Facebook data, open a new Data Studio report or an existing one if you already use the tool. Linking Facebook data to Data Studio is very easy (shown in the example of Supermetrics connectors and Facebook ads data):
1. Click on Resource in the menu, select Manage added data sources and select Add a data source.
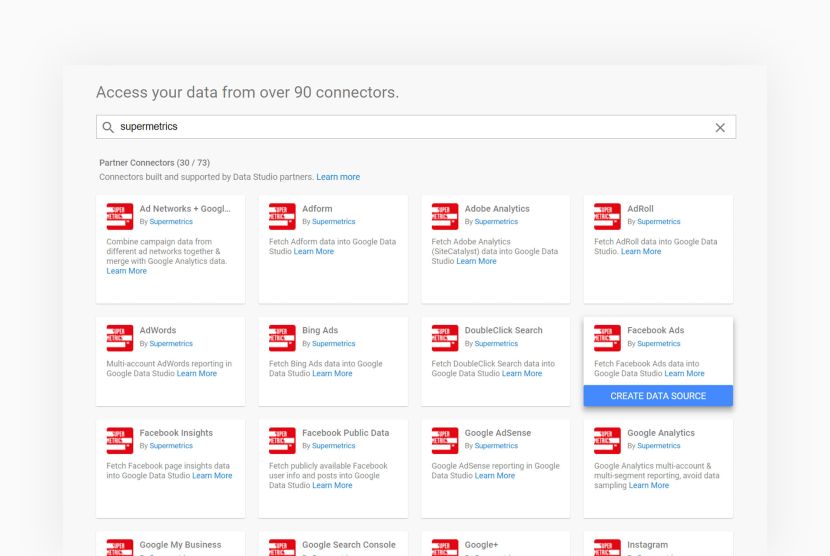
2. In the menu on the left, look for the Explore connectors button and select Supermetrics' Facebook ads connector from the large number of connectors (Note: to use this connector, you must have access to the Supermetrics tool).
3. Select advertising accounts (and the conversion window) you want to link. Although you can select more than one account, we do not recommend linking a large number of accounts or pages at once to one report, since loading a large data set may take some time.
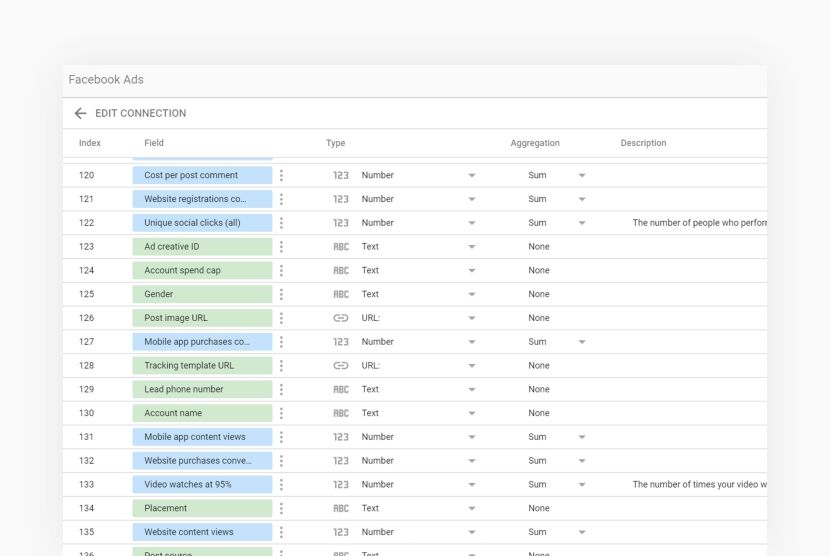
4. Confirm the metrics and dimensions you are importing - be sure to consider metrics that should be expressed in currencies or percentages; you will most likely need to manually choose the correct type of data display.
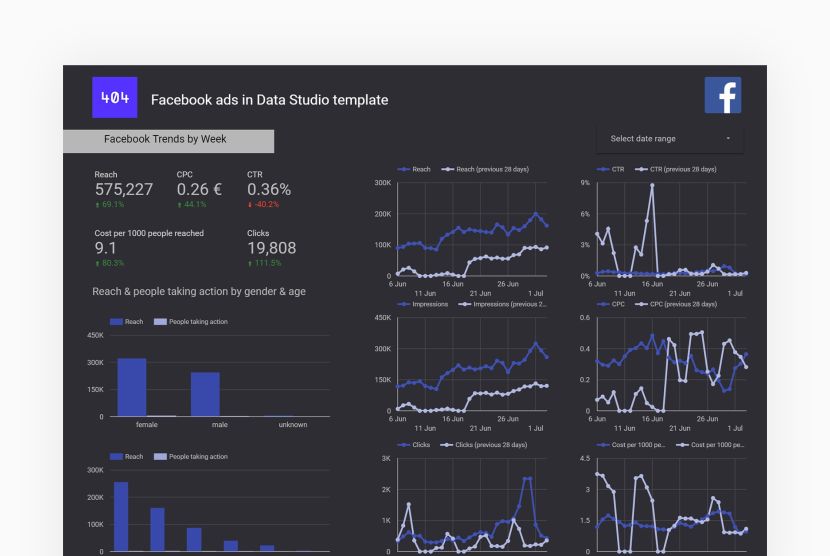
Done! You just linked your Data Studio report with Facebook's advertising data. You can start creating your own Facebook dashboard by selecting one of the data visualization tools. Remember, you can customize everything in visualizations (such as colours, fonts, font sizes), and also insert filters to segment your data (e.g., by device, age, gender). When you are satisfied with the appearance of your dashboard, see how it looks in View mode and share it with the rest of the company using the Share option.
Conclusion
The introduction of the Data Studio Community Connectors program is a great solution that will help agencies, as well as many organizations and companies, to compile analysis with a large number of sources. It is expected that the number of available connectors will increase on a daily basis, and it is yet to be seen which connectors the community will produce itself.